The challenge
The same master data feeds planning, procurement, production and finance. Everyone agrees it is a problem — but nobody can say how big it is, where it sits, or whether it is getting better.
What you get
- A quality score by object, plant and owner, tracked against targets
- Rules defined by the business, in simple language — no coding
- Checks run inside your SAP system; nothing is extracted
- Faster, safer migrations: you know what to clean before you move it
How it works
From define to improve
01
Define
An expectation becomes a rule with an owner, target and weight
02
Measure
Approved rules run on live data, on demand or scheduled
03
Analyze
A weak score drills down to the records behind it
04
Improve
Corrections run through standard processes; the next run proves it
Example
A rule requires every finished-goods material to carry a shelf life and a storage condition. DataLift lists every record that fails it, by plant and owner — and the trend shows when the gap is closed.
In the product
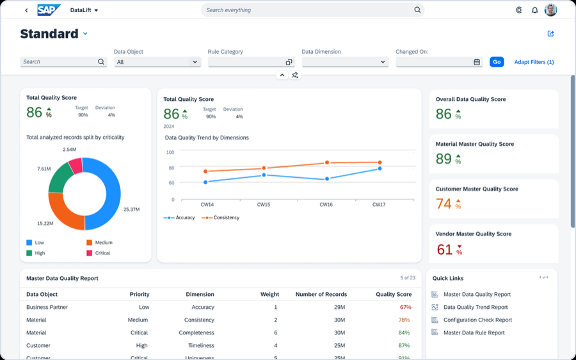
DataLift in practice
Fast to start, safe to run
48 h
From installation to first score
We install and run the first analysis with you.
100+
Best-practice rules included
Material and business partner data — adopt, adapt or extend.
In place
Nothing leaves your system
Rules are evaluated against live tables in your SAP.
Recorded
Every run is logged
Figures, date, time and user — reproducible months later.
Request a DataLift demo.
Book a demo →